Pythonで脳の勾配を計算する - BrainSpace
最終更新日: 2020年7月14日Jupyter Notebookはこちら
BrainSpaceは、Python・Matlabで脳の勾配を計算し視覚化できるパッケージです。
勾配については、脳の階層性を勾配 (Gradients) で捉える!を参考にしてください。
BrainSpace のインストール
pip を使ってインストールできます。
pip install brainspace勾配の計算
BrainSpaceでデータセットを読み込み、実際に勾配を計算しましょう。
Conte69アトラスという、人間の脳表面データを利用します1。
Python
from brainspace.datasets import load_conte69

# Load left and right hemispheres.
surf_lh, surf_rh = load_conte69()脳表面データをプロットする関数もあります2。
Python
import numpy as np
from brainspace.plotting import plot_hemispheres

# Plot the surface data.
labeling = np.ones(surf_lh.n_points+surf_rh.n_points)
plot_hemispheres(surf_lh, surf_rh, array_name=labeling, size=(800, 200),
                 interactive=False, embed_nb=True)

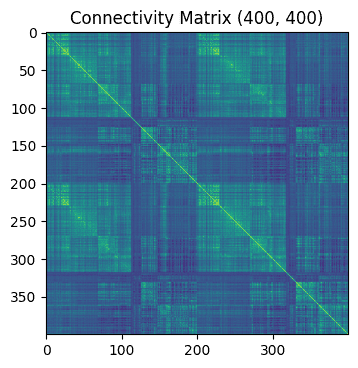
Human Connectome Project (HCP) の安静時fMRIデータから計算した連結性行列(400個の領域間の類似度)を読み込みます。
Python
from brainspace.datasets import load_group_fc
import matplotlib.pyplot as plt

# Load the mean connectivity matrix.
Matrix = load_group_fc('schaefer', scale=400)

# Plot this matrix.
f, ax = plt.subplots(1,1,dpi=100)
ax.imshow(Matrix)
ax.set_title('Connectivity Matrix {}'.format(Matrix.shape))
plt.show()

勾配を計算します。次の方法で、5つの因子を取得します。
- 類似度の計算方法:正規化コサイン類似度 (Normalized angle similarity)
- 低次元への変換方法:拡散マップ (DM, Diffusion Mapping)
brainspace.GradientMaps を使いましょう。
Python
from brainspace.gradient import GradientMaps

# Build gradients using diffusion maps and normalized angle and fit to the data.
gm = GradientMaps(n_components=5,
                  kernel='normalized_angle',
                  approach='dm',
                  random_state=0)
print(gm.fit(Matrix))

# Plot this gradients.
f, ax = plt.subplots(1,1,dpi=100)
ax.imshow(gm.gradients_[:50].T)
ax.set_title('Gradients {}'.format(gm.gradients_.shape))
plt.show()

計算した勾配の第1因子を描画します。各領域の勾配値を脳表面にマッピングすることで描画することができます3。
Python
from brainspace.datasets import load_parcellation
from brainspace.utils.parcellation import map_to_labels

# Map to original size
labeling = load_parcellation('schaefer', scale=400, join=True)
mask = labeling != 0
grad = map_to_labels(source_val=gm.gradients_[:, 0],
                     target_lab=labeling,
                     mask=mask, fill=np.nan)
print('Gradients example: \n {}'.format(grad[:5]))

# Plot on the surface.
plot_hemispheres(surf_lh, surf_rh, array_name=grad, size=(800, 200),
                 label_text=['Grad1'], color_bar=True,
                 interactive=False, embed_nb=True)

先行研究通りに、デフォルトモードネットワークから感覚領域への勾配がみられました。
集団間の比較
今度は、被験者集団を2つに分けたときの勾配を比較します。
集団間の勾配を揃えるために、プロクラステス解析を行います。
Python
import numpy as np
from brainspace.datasets import load_group_fc, load_parcellation, load_conte69
from brainspace.gradient import GradientMaps

# Load the conte69 hemisphere surfaces
surf_lh, surf_rh = load_conte69()

# Load the connectivity matrix
Matrix1 = load_group_fc('schaefer', scale=400)
Matrix2 = load_group_fc('schaefer', scale=400, group='holdout')
labeling = load_parcellation('schaefer', scale=400, join=True)
mask = labeling != 0

# Build gradients
gm = GradientMaps(n_components=5,
                  kernel='normalized_angle',
                  approach='dm',
                  alignment='procrustes', # Procrustes analysis
                  random_state=0)
print(gm.fit([Matrix1, Matrix2]))
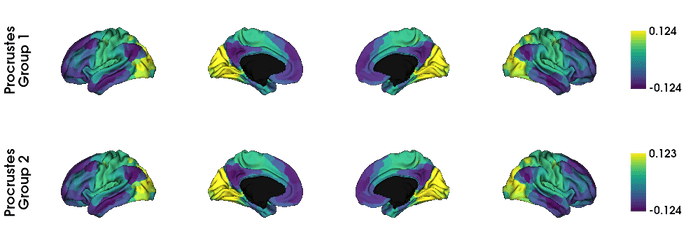
計算した勾配を描画します。
Python
from brainspace.utils.parcellation import map_to_labels
from brainspace.plotting import plot_hemispheres

gradients_list = []
for i in range(2):
    gradients_list.append(map_to_labels(gm.aligned_[i][:, 0], labeling,
                                        mask=mask, fill=np.nan))

label_text = ['Procrustes\nGroup 1', 'Procrustes\nGroup 2']
plot_hemispheres(surf_lh, surf_rh, array_name=gradients_list, size=(1000, 350),
                 color_bar=True, label_text=label_text,
                 interactive=False, embed_nb=True)

この例では、集団間に大きな違いはありませんでした4。
まとめ
- 連結性などを計算しておく。
Matrix = Compute_Connectivity(data)- 勾配を計算する。
GradientMaps(options).fit(Matrix)- 脳表面アトラスに描画する。
plot_hemispheres(surf_lh, surf_rh, labels)- Conte69 Human Surface-based Atlas and Reference Data↩
- 頂点の座標とその値(ラベル)があれば描画できます。↩
- ラベルを参照して、計算した勾配値を各頂点に埋め込みます。↩
- hold-outしただけの被験者集団なので違いは無くてよいはずです。↩
Sponsored Link