sn42
R&D Job in Japan.
Topics
My Twitter
Jupyter Notebookはこちら
NilearnはfMRIデータなどの扱いや統計的学習に特化したPythonパッケージです。
Nilearn is a Python module for fast and easy statistical learning on NeuroImaging data. - Nilearn
Nilearnを利用して次のようなことができます。
また、種々のクラスやメソッドが scikit-learn like になっています。
ここでは
を参考に結合性解析とネットワーク解析を行っていきます。
pipでインストールできます。
pip install nilearnまず、アトラスデータをダウンロードします。
ここでは、Dosenbach et al. のアトラスを利用しました。領域(ROI)ごとに座標・領域名・ネットワーク名があります。
from nilearn import datasets, image

# Load the atlas dataset
atlas = datasets.fetch_coords_dosenbach_2010()
coordinates = atlas['rois']
labels = atlas['labels']
networks = atlas['networks']

for coord,label,network in zip(coordinates[:3],labels[:3],networks[:3]):
print("coord:{}, label: {}, network: {}".format(coord,label,network))coord:(18, -81, -33), label: b'inf cerebellum' 155, network: b'cerebellum'
coord:(-21, -79, -33), label: b'inf cerebellum' 150, network: b'cerebellum'
coord:(-6, -79, -33), label: b'inf cerebellum' 151, network: b'cerebellum'次に、Resting-state fMRI (rsfMRI) データをダウンロードします。
ここでは、ABIDE1のrsfMRIデータを利用しました。1人分のデータを取得します。
4D画像のサイズは (61, 73, 61, 196) です。(つまり 196 TRs)
# Load the resting-state functional dataset
data = datasets.fetch_abide_pcp(n_subjects=1)
print("the shape of 4D Image:", image.load_img(data.func_preproc[0]).shape)
print("the zoom of 4D Image:", image.load_img(data.func_preproc[0]).header.get_zooms())the shape of 4D Image: (61, 73, 61, 196)
the zoom of 4D Image: (3.0, 3.0, 3.0, 1.5)rs-fMRIデータのボクセル 個同士の相関を考えるのではなく、160個の領域(ROI)同士の相関を考えることにします。そのために、各領域の信号を抽出します。
今回はアトラスが座標データなので、その座標を中心とした球体を領域として信号を抽出します。
from nilearn import input_data

masker = input_data.NiftiSpheresMasker(seeds=coordinates, radius=4.5,
                                        detrend=True, standardize=True,
                                        low_pass=0.1, high_pass=0.01, t_r=1.5,
                                        memory='nilearn_cache', memory_level=1)

time_series = masker.fit_transform(data.func_preproc[0])
print("the shape of time series:", time_series.shape)the shape of time series: (196, 160)196 TRs 160 ROIs の時系列データが抽出されました。
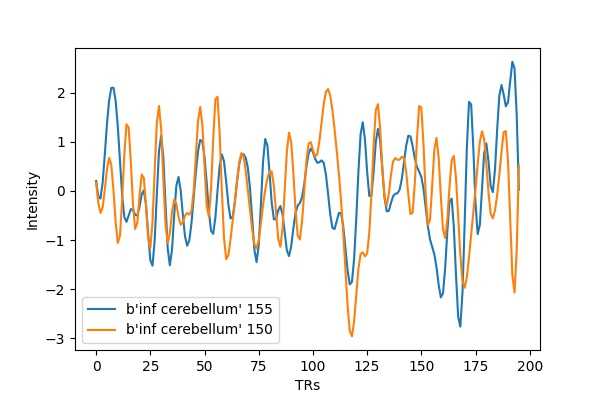
例として2つの領域の信号を見てみましょう。
import matplotlib.pyplot as plt

f = plt.figure(dpi=100)
plt.plot(time_series[:,0], label=labels[0])
plt.plot(time_series[:,1], label=labels[1])
plt.xlabel("TRs"); plt.ylabel("Intensity")
plt.legend(); plt.show()

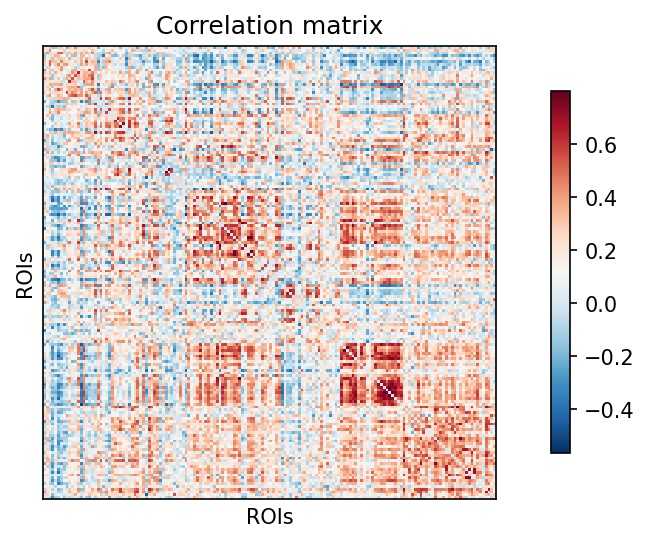
時系列データの相関行列を計算して描画します。これが領域同士の結合性となります。
今回は "correlation" を計算しました。{"correlation", "partial correlation", "tangent", "covariance", "precision"} の中から選ぶことができます。
import numpy as np
from nilearn import connectome, plotting

# Build the correlation matrix
correlation_measure = connectome.ConnectivityMeasure(kind='correlation')
correlation_matrix = correlation_measure.fit_transform([time_series])[0]

# Display the correlation matrix
np.fill_diagonal(correlation_matrix, 0)
plotting.plot_matrix(correlation_matrix, colorbar=True)
plt.title("Correlation matrix"); plt.xlabel("ROIs"); plt.ylabel("ROIs")
plt.xticks([]); plt.yticks([]); plt.show()

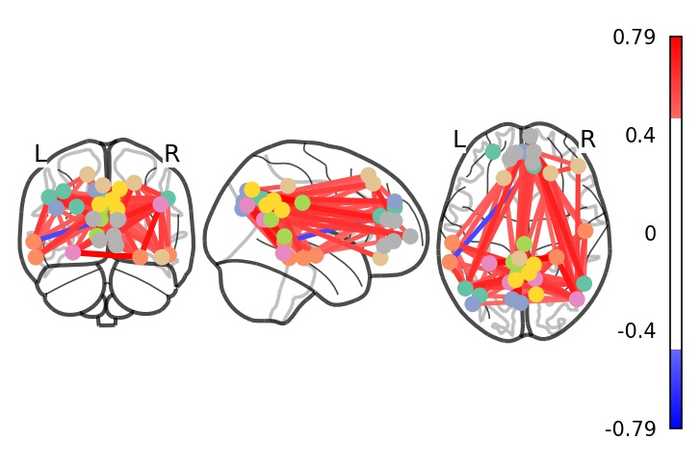
さらに、脳内のネットワークとして視覚化しましょう。
ここでは、例として Default Mode Network (DMN) の結合性を見てみます。
index = np.where(networks == b'default')[0]
coords_array = np.array([list(coords) for coords in coordinates[index]])

plotting.plot_connectome(correlation_matrix[index][:,index],
                         coords_array,
                         edge_threshold="80%", colorbar=True)
plotting.show()

view = plotting.view_connectome(correlation_matrix[index][:,index],
                                coords_array,
                                node_size=5.0, edge_threshold='80%')
view.save_as_html("3d_connectome.html")
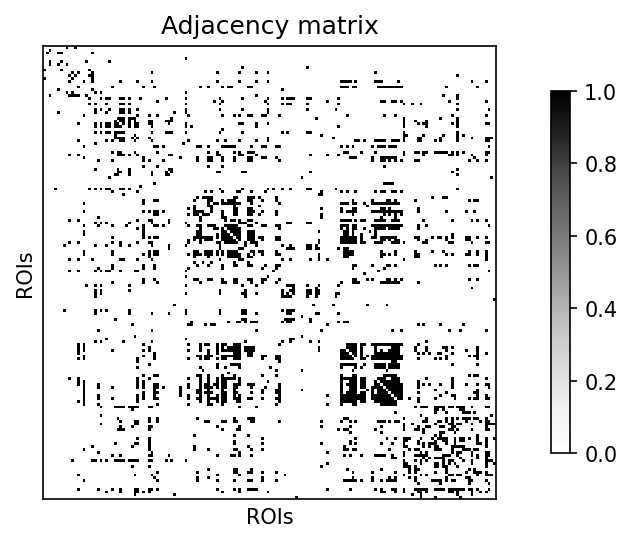
viewまず、相関行列の上位10%のみを残して重みなしの隣接行列を作成します3。
edge_threshold = np.percentile(connectome.sym_matrix_to_vec(correlation_matrix), 90)
adjacency_matrix = correlation_matrix.copy()
adjacency_matrix[adjacency_matrix >= edge_threshold] = 1
adjacency_matrix[adjacency_matrix != 1] = 0

plotting.plot_matrix(adjacency_matrix, colorbar=True, cmap='Greys')
plt.title("Adjacency matrix"); plt.xlabel("ROIs"); plt.ylabel("ROIs")
plt.xticks([]); plt.yticks([]); plt.show()

今回は、例としてクラスタリング係数 という指標を計算しようと思います。
networkx4のグラフに変換して、クラスタリング係数を計算します。
import networkx as nx

G = nx.from_numpy_matrix(adjacency_matrix)
print("the number of Nodes:", G.number_of_nodes())
clustering_coefficient = np.mean(list(nx.clustering(G).values()))
print("Clustering Coefficient: {:.3f}".format(clustering_coefficient))the number of Nodes: 160
Clustering Coefficient: 0.431参考:CONN - Clustering Coefficient
以上となりますが、他にも信号の取得方法やグラフ指標などに様々な方法が利用されているので調べてみて下さい!