ボルテラモデルでBOLD反応をモデル化する
最終更新日: 2020年7月26日Jupyter Notebookはこちら
非線形なBOLD反応
神経活動と共に血流流量が増加することで、BOLD反応が重ね合わせの原理を破ることがあります。重ね合わせの原理を破るということは、線形関係の成り立たない非線形な反応が生じるということです。
非線形な応答をモデル化した有名な例は バルーンモデル (Balloon model; Buxton et al. (1998)) であり、神経活動からBOLD反応が生成する過程を詳細にモデル化することで非線形な反応をモデル化しました。
しかし、バルーンモデルは複雑であるために計算量が膨大となってしまいます。そこで、非線形性だけに注目し、非線形系理論を応用すると計算量を削減できます。ここでは、ボルテラモデル (Volterra model) という非線形系のモデルを利用してBOLD反応をモデル化します。
ボルテラモデル (Volterra model)
時間不変なシステムは、入出力の関係をボルテラ級数で表現できます。ここで、 を 次ボルテラカーネルといいます。
ボルテラ級数を用いて、BOLD反応 と神経活動 の関係を表現します。
Friston et al. (1998) は、非線形なBOLD応答は次の式で近似できるとしました。
さらに、Friston et al. (1998) では、 次ボルテラカーネルを次のように設計しました。
ここで、 は次のようなガンマ基底関数です。
したがって、BOLD反応の 次ボルテラモデルは次のようになります。
シミュレーション
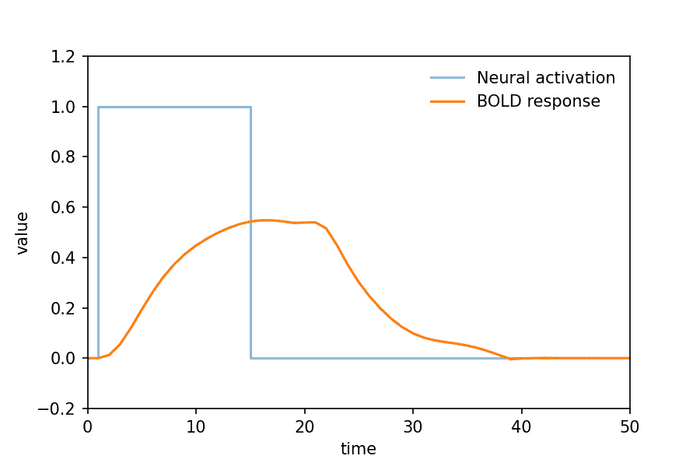
ボルテラモデルを Python を使用してシミュレーションします。
次の例では、 とし、他のパラメーターを としました。
まずは、1回の神経活動に対してシミュレーションしましょう。
import numpy as np
import math
import matplotlib.pyplot as plt

# Set the experimental condition
time = np.arange(100)
boxcar = np.zeros(100); boxcar[1:21] = np.ones(20)

# Calculate a Volterra series.
def volterra_bold(time, boxcar, alpha = [0.2, 0.2, 0.2], beta = [[0.1, 0, -0.2], [0, 0, 0], [0, 0, 0]]):
    b1 = ((np.power(time, 3)) * np.exp(-time) ) / math.factorial(3)
    b2 = ((np.power(time, 7)) * np.exp(-time) ) / math.factorial(7)
    b3 = ((np.power(time, 15)) * np.exp(-time) ) / math.factorial(15)
    x1 = np.convolve(boxcar, b1)
    x2 = np.convolve(boxcar, b2)
    x3 = np.convolve(boxcar, b3)
    x = np.array([x1, x2, x3])

    alpha = np.array(alpha)
    H1 = np.dot(alpha, x)

    beta = np.array(beta)
    H2 = np.dot(beta.flatten(),
                (np.array([x,x,x]) * np.array([x,x,x])).reshape(9,-1))
    return H1 + H2

# Plot the results.
time_for_display = [0,1] + list(range(1,16)) + list(range(15,100))
boxcar_for_display = [0]*2 + [1]*15 + [0]*85
f, ax = plt.subplots(1,1,dpi=150)
ax.plot(time_for_display, boxcar_for_display,
        label='Neural activation', alpha=0.5)
ax.plot(volterra_bold(time, boxcar),
        label='BOLD response')
ax.set_xlim(0,50); ax.set_ylim(-0.2,1.2)
ax.set_xlabel('time'); ax.set_ylabel('value')
ax.legend(loc='best', frameon=False)
plt.savefig('volterra_hrf1.png')
plt.show()

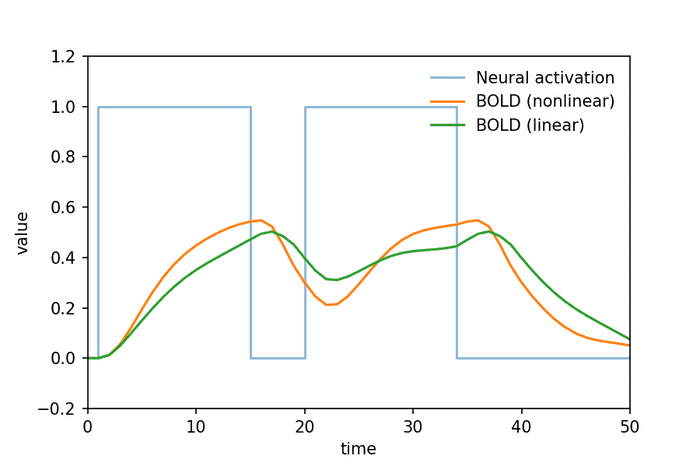
次に、複数回の神経活動に対してもシミュレーションしましょう。
ここでは、全ての とした線形モデルも一緒にシミュレーションしました。
# Set the experimental condition
time = np.arange(100)
boxcar = np.zeros(100); boxcar[1:16] = np.ones(15); boxcar[21:36] = np.ones(15);

# Plot the results.
time_for_display = [0,1] + list(range(1,16)) + list(range(15,21)) + list(range(20, 35)) + list(range(34, 100))
boxcar_for_display = [0]*2 + [1]*15 + [0]*6 + [1]*15 + [0]*66
f, ax = plt.subplots(1,1,dpi=150)
ax.plot(time_for_display, boxcar_for_display,
        label='Neural activation', alpha=0.5)
ax.plot(volterra_bold(time, boxcar),
        label='BOLD (nonlinear)')
ax.plot(volterra_bold(time, boxcar, beta=[[0]*3,[0]*3,[0]*3]),
        label='BOLD (linear)')
ax.set_xlim(0,50); ax.set_ylim(-0.2,1.2)
ax.set_xlabel('time'); ax.set_ylabel('value')
ax.legend(loc='upper right', frameon=False)
plt.savefig('volterra_hrf2.png')
plt.show()

Reference
- Ashby, F. G. (2019). Statistical analysis of fMRI data. MIT press.
- Buxton, R. B., Wong, E. C., & Frank, L. R. (1998). Dynamics of blood flow and oxygenation changes during brain activation: the balloon model. Magnetic resonance in medicine, 39(6), 855-864.
- Friston, K. J., Josephs, O., Rees, G., & Turner, R. (1998). Nonlinear event‐related responses in fMRI. Magnetic resonance in medicine, 39(1), 41-52.